Analyzing the Google Hertz Doodle
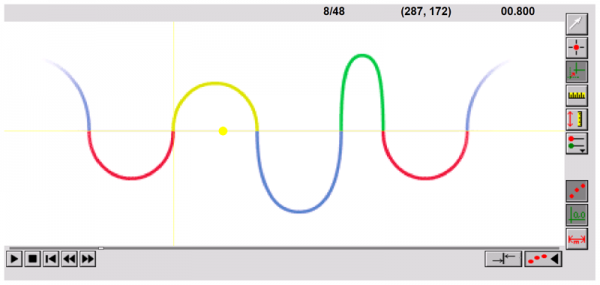
Google honored physicist Heinrich Hertz with a Doodle on what would have been his 155th birthday. The wavy doodle scrolls by with color coded crests and troughs that represent the letters in the standard Google logo.
Just like the Newton doodle, this logo screams for analysis.
It turns out that the doodle is a simply animated gif. Since gif files can be opened in Quicktime, I used the video analysis in Vernier’s Logger Pro to get the time for the doodle’s first trough (the first “o” in Google) to pass. This value is 0.8 seconds. That makes 1.6 seconds for a complete period and 1/1.6 seconds gives us a frequency of 0.62 Hertz. If this letter was traveling at the speed of light, it would have a wavelength that is 483536 kilometers long.
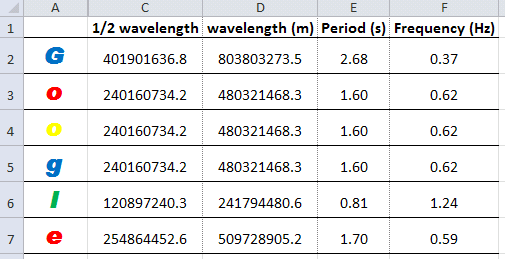
Using the photo analysis in Logger Pro, I found the wavelenghs for the other letters of the doodle by scaling the photo with the wavelength calculated for the first “o” in the doodle.
Here are my results:

